
Buyer & Seller Behavioral Segmentation
Grouping the buyers and sellers of a double-sided marketplace based on behavioral attributes in order to more deeply understand their distinct needs and serve them better.
ROLE Research Lead
How were customers grouped?
I used a process of behavior segmentation based on Indi Young's task-based audience segments found in her book Mental Models. This is a process of grouping customers based on how they act, think, or feel. It is usually conflated with personas, which are generally more based on demographics.
Behavioral segmentation can result in more effective grouping since, for instance, not all 19 year olds exhibit the same buying behavior. Personas would lump 19 year olds together and behavioral segmentation might group them based on frequency or amount of purchases.
results
I found that buyers could be organized across a 2x2 matrix using time and money spent on the site as the x-axis and y-axis. The archetypes that resulted included:
Loyalist (highly engaged, repeat buyers)
Get in, Get out (purpose-driven shoppers, little exploration)
Input Seekers (there to get creative inspiration, not necessarily buy)
Window Shoppers (visitors just looking around the site)
Freebees (no money spent, only getting free things)
For sellers, their placement along 4 key attribute scales indicated 4 groups to prioritize.
Archetypes:
Accomplished Generalist (skilled along all attribute scales)
Side Hustlers (low investment in marketplace and product creation)
Mystified by Marketing (lacked Marketing expertise to help promote and sell their product)
Creator, not business owner (prioritized creation process over business strategy)
Attribute Scales:
Investment in the marketplace
Maturity/Experience within their product space
Marketing skillset
Technical & Design Talent

Buyer Archetypes arranged on 2x2 (Time & Money Spent on site). Buyers all begin as Window Shoppers and move into another Archetype.
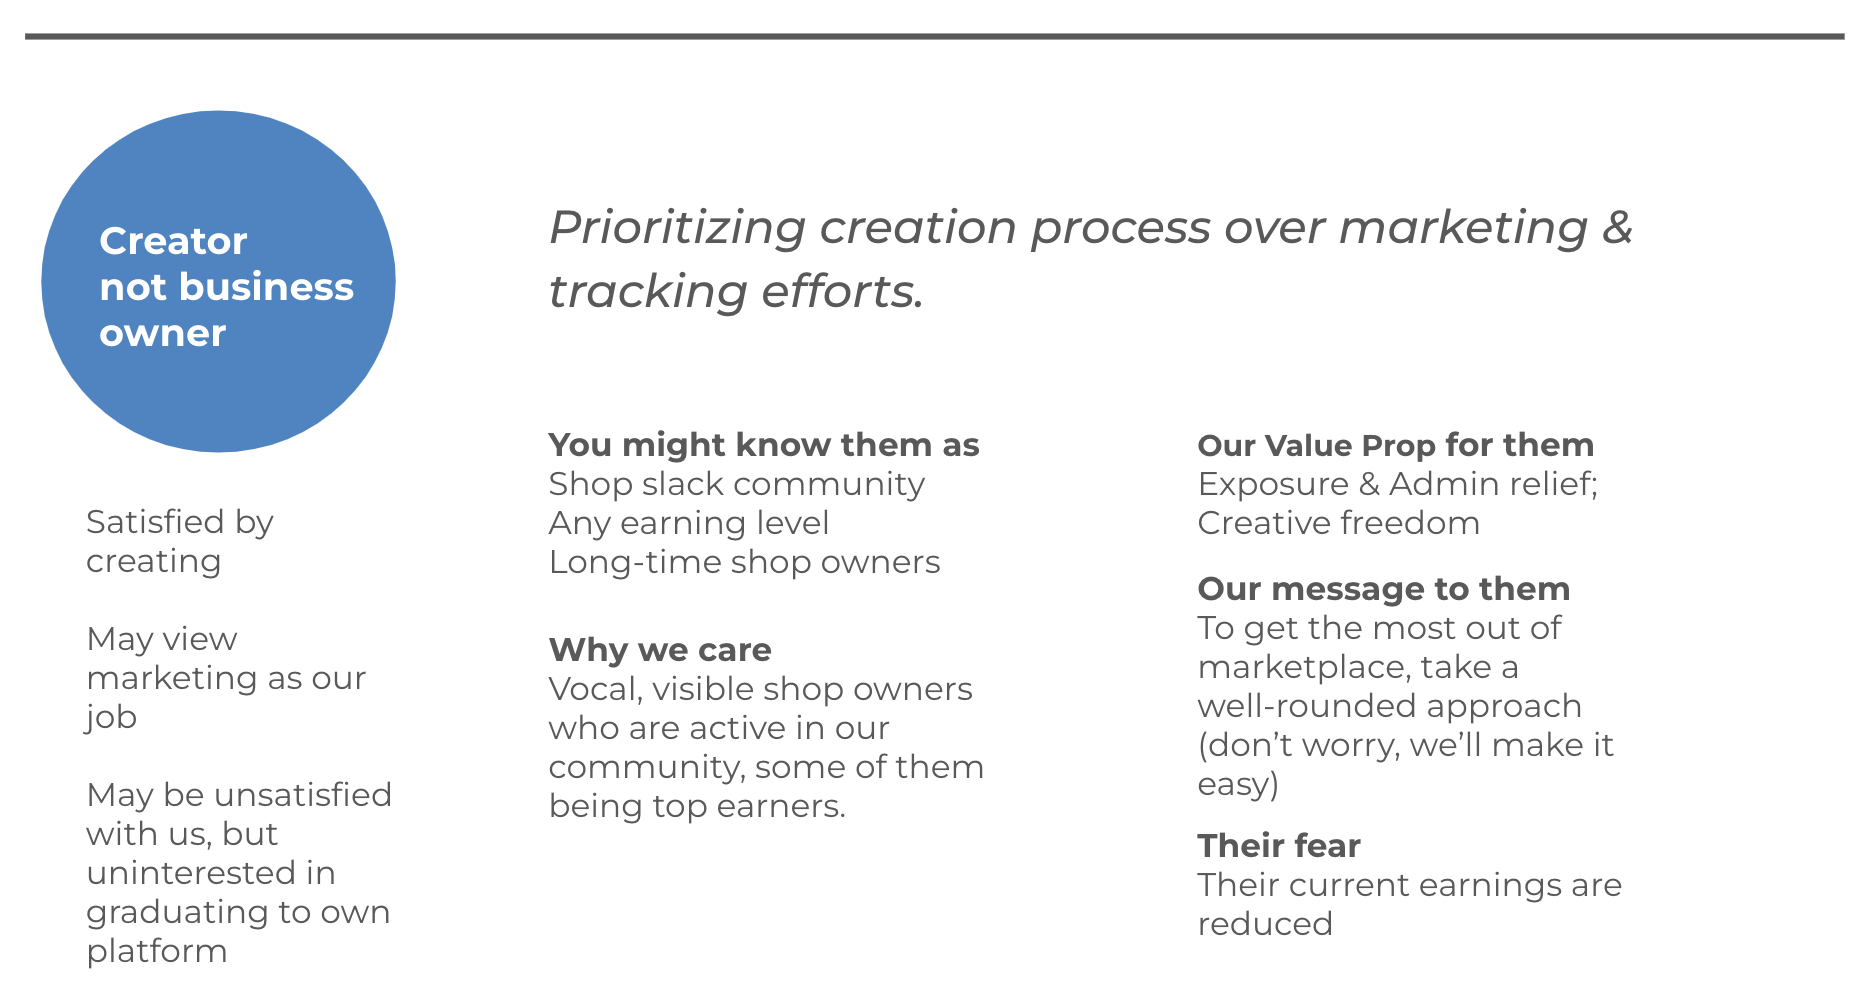
An in depth look at a Seller Archetype
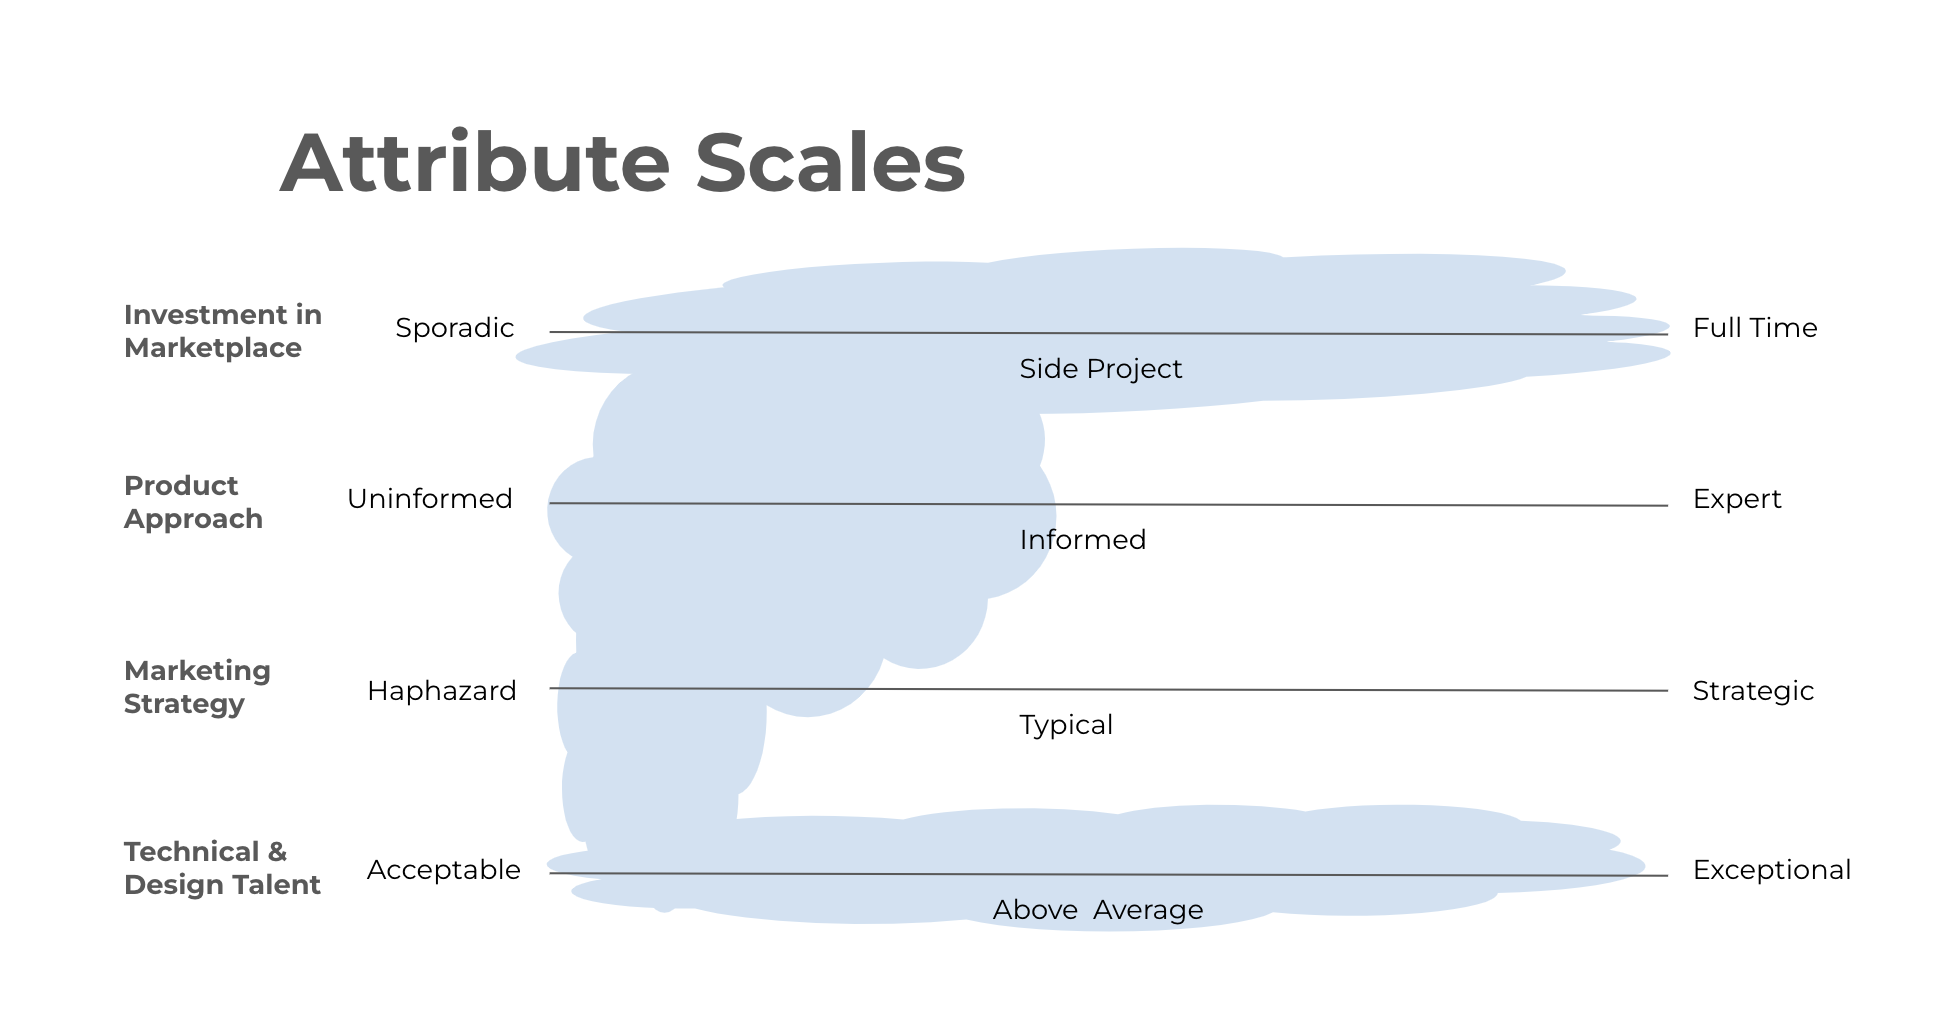
The blue area shows where the Seller Archetype, Creator not business owner, could fall along each attribute scale. In particular, they tended to deprioritize marketing skills.
Research Approach
This project consisted of 2 distinct studies, one focused on Buyers, the other Sellers. The main research questions were the same for each study:
Who are our buyers/sellers?
What distinguishes our buyers/sellers from each other?
What are they getting out of our marketplace?
How can we better serve them?
I interviewed participants via video chat discussing the following topics
Sellers
Who are they and what’s their creative process?
How does the current upload experience work for them?
How do they define quality?
How do they approach pricing, marketing, and tracking of their products?
How does the marketplace experience compare with any other place they sell?
Buyers
Who are they and what’s their creative process?
What are their typical routines while on the marketplace?
How do they evaluate products for purchase?
What do they create with things they purchase?
How else do they engage with the marketplace, if applicable?
Perceived Performance of Mobile Browser Apps
Comparing how customers rate speed and experience between an existing app and a competitor and between an existing app and a rebuilt version
ROLE Research Lead
What is Perceived Performance & why does it matter?
Perceived performance is important to consider when you have questions about gaining and keeping daily active users and winning market share. It’s a person’s subjective assessment of how quickly and responsively an app or site behaves. Perceived performance is NOT (usually) the same as actual performance measured in (milli)seconds. If a customer perceives one app as more performant than a competitor, even if there is no actual performance difference, the person may still choose to use the perceived more performant one over the other.
results
Significant differences in perceived responsiveness and overall performance were uncovered in both phases of research. These differences were more noticeable in low bandwidth groups, which was an insight incorporated into future testing protocols. Attempting actions during page load as well as scrolling issues were significant contributors to the perceived performance differences.
Research Approach
This project consisted of 2 phases of benchmarking: how did the existing browser app perform compared to the market leader AND how did a rebuilt browser version perform compared to the existing version. The research goal was to identify opportunities to increase overall daily active users.
I had 21 participants perform a series of typical mobile browser tasks on each browser during a 45 minute, in-person session. They then rated each browser per task (as well as overall) along responsiveness and ease of use scales, like the example below.

Rating scales and approach based on techniques discussed in Chapter 9 of Designing & Engineering Time: The Psychology of Time Perception in Software by Steven C. Seow, Ph.D.
Once the series of tasks and ratings were completed for each browser, participants indicated which browser they preferred for each task as well as overall using questions like the example below.

Preference questions per task and overall.
For the phase comparing the existing app with a competitor, unbranded versions were used to reduce brand effect. I also ensured that the browser order alternated for each participant and the task order was changed each day of sessions to reduce ordering effect. In order to understand the effect of bandwidth, speed tests were done prior to each session for benchmarking. I also used a low performing device for half the participants and a high performing device for the others.
Participants were also asked to do a card ranking activity to understand their 3-5 most important criteria when evaluating the responsiveness of a mobile browser. Participants had the option of including their own criteria or choosing from the options we provided, which including choices like
Not having the page jump around while scrolling
Tapping something produces the intended action (even if the page isn’t fully loaded)
Loading a website
After data collection, I analyzed the ratings for statistically significant differences using (un)paired, two tailed, Welch’s T-tests. I also looked at the data
Overall
By task
By Browser Order
By Bandwidth
Timeline feature in Asana
End to end research for a new feature in a SaaS web-app
ROLE Research Lead
What is timeline?
Timeline in Asana helps teams create a visual project plan, similar to gantt chart. so they can stay on schedule and see where work needs to be adjusted in order to hit their deadlines and project goals.
results
As part of the NYC Asana product team, we worked closely with product, business, and customer-facing stakeholders to research, design, and build an entirely new feature that was highly requested by customers. By launching this feature, we positioned Asana more competitively in the market. Based on our work, conversions to premium rose over 50% and the feature had 70% higher engagement than our targets. We also saw significant, positive press coverage at launch.
Research Approach
Since this was an end to end project, the research started broad and exploratory to uncover key customer requirements and business needs then narrowed and became quicker loops focused on validation, usability, and overall market fit.
I first started with a couple rounds of foundational & generative research where I interviewed people who lead projects about how they currently created and tracked project plans. This as well as some competitive analysis of other tools was used as input for concept mocks. These mocks were then used to validate key requirements and needs of our target customers.
Next, the NYC Asana product team built a beta version of Timeline so I could gather real life feedback over the course of customers' actual project lifecycles. I collected unprompted feedback via a link in the product, sent out weekly surveys, and held a few rounds of usability sessions. During the research, we discovered a couple key pieces of functionality were left out of our MVP and were able to address these needs in order to help create an even more successful launch.
SElected Insight
One insight we investigated involved low retention after initial use by beta participants who had previously voiced a need and enthusiasm based on our concept mocks. We realized the initial experience of a project's Timeline, for a fairly built out project, looked sparse and unfamiliar to the project owners.
Here on the left is a fairly populated project built in the List view of Asana. There are Sections (headings), assignees, due dates and some other structural elements created by the project owner. On the right was the initial moment participants had when clicking into the Timeline tab for this project. The moment on the right did not feel familiar nor represent the project on the left during that first moment with Timeline.
Based on this insight & its subsequent recommendation, the engineers and designer figured out a way to ensure a certain density of tasks were shown on the screen for the initial click into Timeline. They achieved this by varying the timeframe & the number of rows shown (the vertical & horizontal axes).
The left screen is the same project as the above image but the right screen shows more of what was expected by participants when initially clicking into this project's Timeline.
Customer Profiles for Asana
Discovering & validating distinct groups of customers to help better deliver on a diverse set of needs
ROLE Research Lead
How were customers grouped?
We used a process of behavior segmentation based on Indi Young's task-based audience segments found in her book Mental Models. This is a process of grouping customers based on how they act, think, or feel. It is usually conflated with personas, which are generally more based on demographics.
Behavioral segmentation can result in more effective grouping since, for instance, not all 19 year olds exhibit the same buying behavior. Personas would lump 19 year olds together and behavioral segmentation might group them based on frequency or amount of purchases.
results
We discovered, validated, and refined 4 groups of customers; detailing how people in those groups acted at work, what motivated them, how they purchased and evaluated work products, and whether they had buying power. We also looked at the dynamics between different group's members. These groups became established components of Asana's development process and are still utilized today, for instance, as a way to prioritize what's built for a given feature based on which profile is targeted.
We also worked with our data science team to come up with estimates for how prevalent each group was in our user base as well as how prevalent each group might be in the general workforce. This helped us uncover opportunities for features and functionality to serve under-represented groups within our customer base.
Research Approach
First, the research team developed a hunt statement that captured the specific customer behavior we wanted to dig into. For this project, it was about distinguishing work behaviors, notably NOT how people wanted to behave at work. Once the hunt statement was finalized, we sourced specific behaviors not only from the research team but from the broader product team. One example of a behavior would be "Prepares thoroughly for every project."
Once we had enough behaviors, we could start to correlate them to build out initial profiles. The person who prepares thoroughly might also keep detailed checklists. These initial profiles were then validated and refined by interviewing people about how they worked.
Based on the validated profiles, I developed 4 questions that could reliably place people into one of the 4 groups we ended up with. We then continued to enrich these profile groups over several years by including the screening questions and profile debriefs in pretty much every other project we did.
SElected Research Components
As part of the interview process, I developed a piece of homework based on mad-libs. This was a way to get a sense for how the participant felt about their work and company before we spoke to them. This was not only a structured way to compare participant answers across groups, but it was fun for the person to fill out!
A mad-libs based activity for participants to share how they worked.
Another component we developed during this project were attribute scales that could potentially impact how the product was developed including work style, work engagement, and communication style. We then plotted possible profiles, based on the behaviors we sourced from the product team that were in line with our hunt statement, along these scales.
Possible profiles based on behaviors in line with the hunt statement. Some of these were later validated and refined into the final profile groups.